We’ve updated OpenDataCommunities to the latest version of Swirrl’s PublishMyData platform with some great new features as standard, enhancements to existing functionality and removal of some obsolete features and datasets. I’ll come onto the changes shortly but first I want to emphasise that we will continue to improve the platform.
What does the future hold?
We'll continue to work with Swirrl and their other clients to improve the tools allowing users to search for, access and use the data (not everyone is a SPARQL expert, or inclined to become one!). We will continue to publish data as linked data on OpenDataCommunities and we’ll continue to adopt standard and improve the technical data quality
We would like to hear your views on the platform, the features and the data so please contacts us via email at ODC@communities.gsi.gov.uk. In fact, in collaboration with Swirrl we’re about to launch a user engagement review focussing on these things so please keep an eye on our blog
What changes have we made?
We’ll write more detailed articles about the changes over the coming weeks explaining how you can make the most of these features. For the mainstream user there are 3 significant changes
- Browsing by geographic area
- New charting and mapping features for data sets
- A new datacart feature allowing you to create your own dataset
It's important to note that the datasets you view or create have persistent URI's, meaning you can save them, share them and return to them
Many of the data sets on OpenDataCommunities are multi-dimensional (multiple variables in the dataset) and you can learn more about this in excellent blog post . Or you can read the help article.
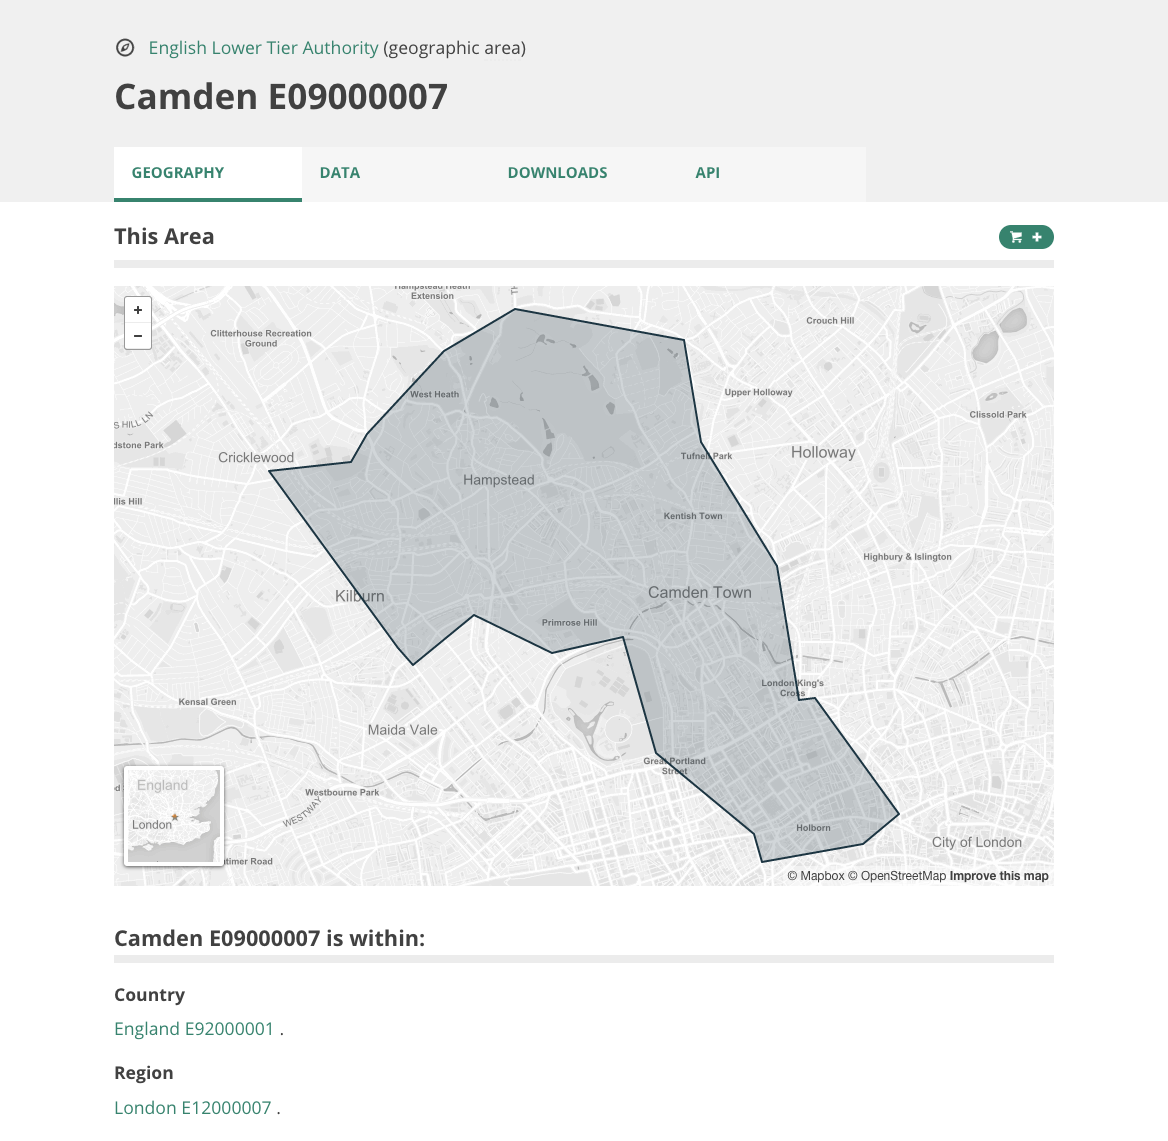
Browsing by area
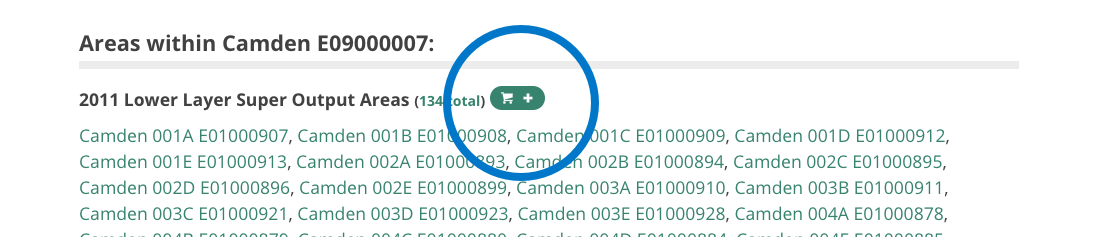
Any area you browse to regardless of type of area will provide information available about that area. It'll contain information such as a list areas within this area, or which areas it is a part of like in the example below
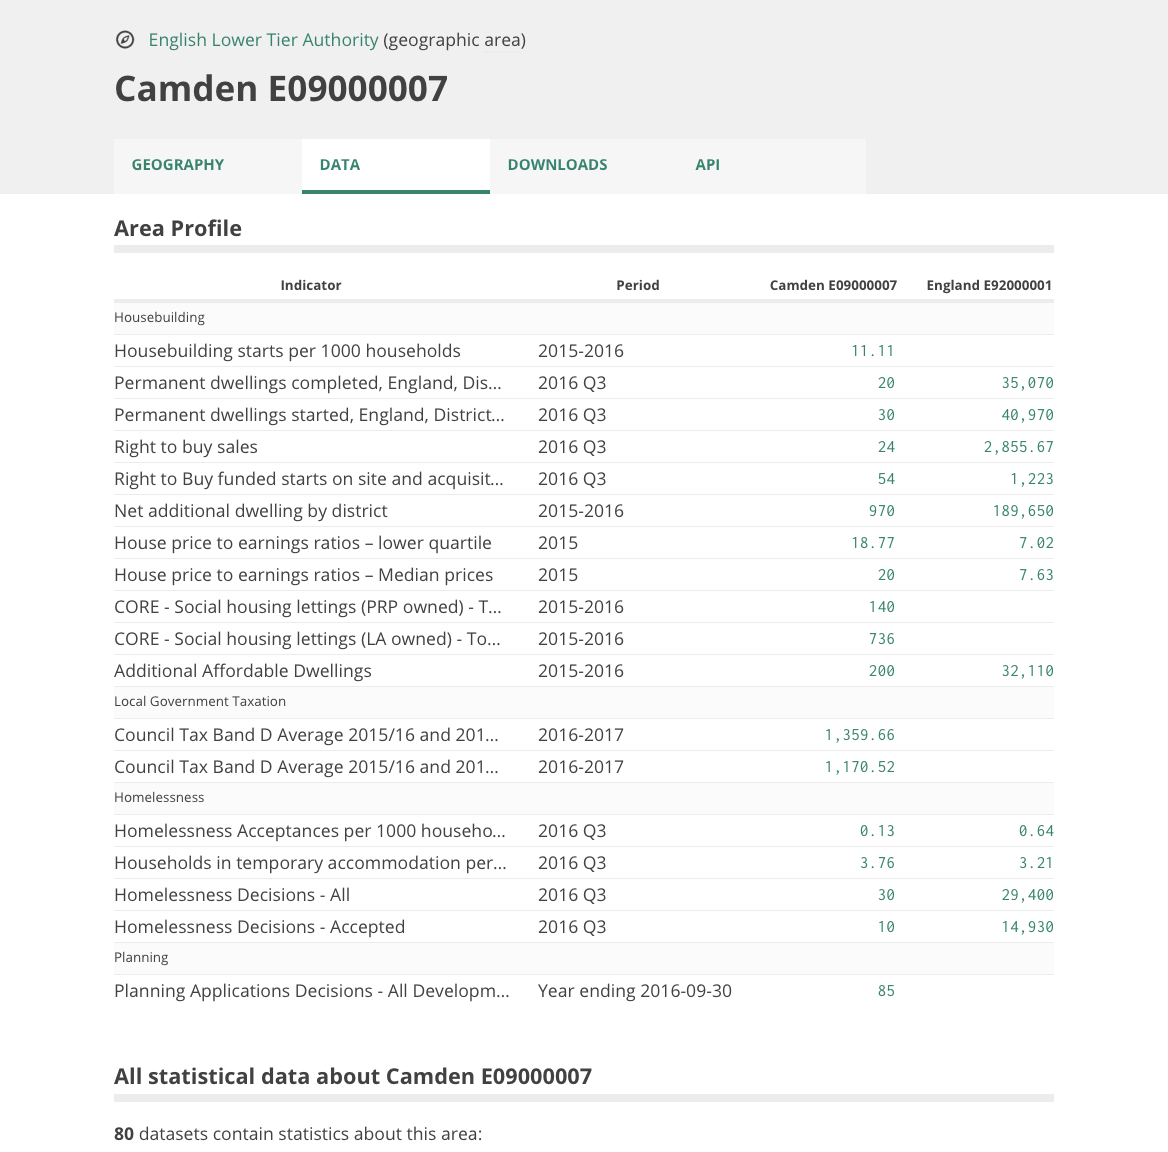
The data tab also provides headline statistics for the most recently published time series and list the datasets directly linked to the geographic for example
Read the help article on browsing data.
Charting and mapping features
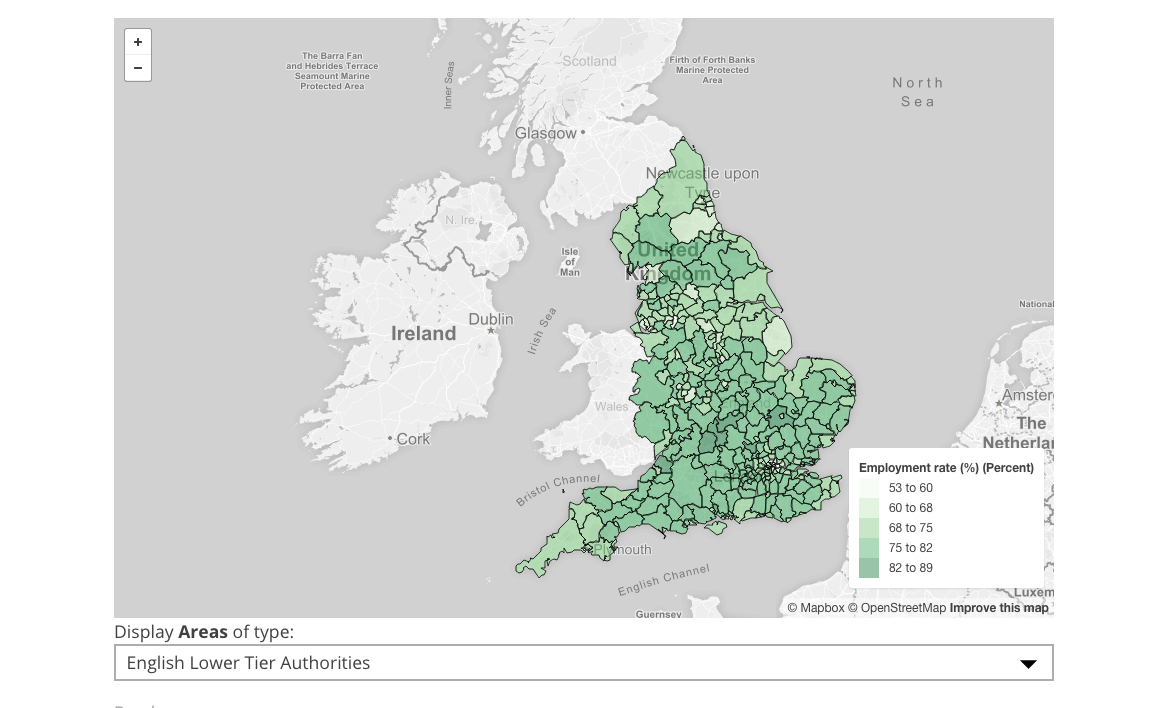
When you select a column of most datasets you can visualise the data on a map like below
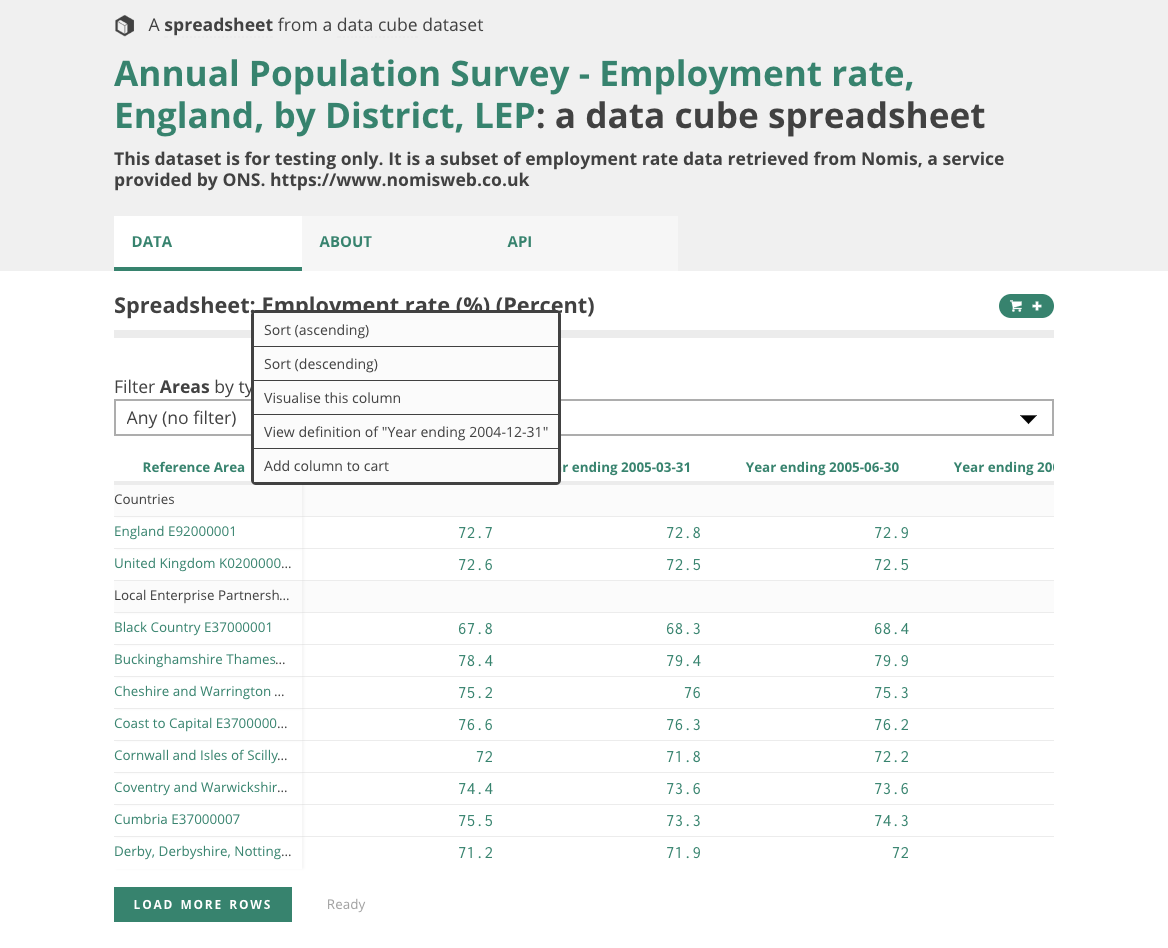
If you were to select an individual cell you can visualise the data in a charts like below
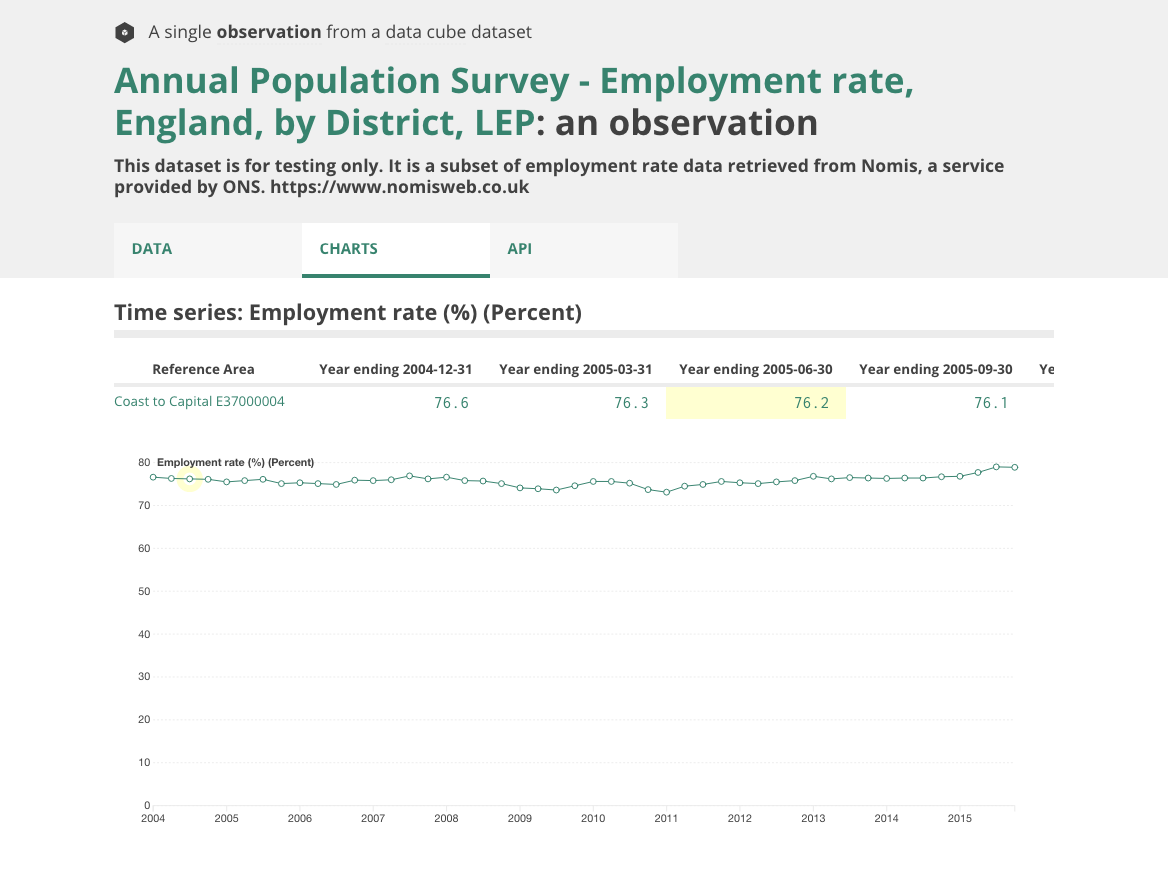
Read the help article on working with visualising data.
The persistent URI 's mean you can save them to your favourites and go back to them later or share the link.
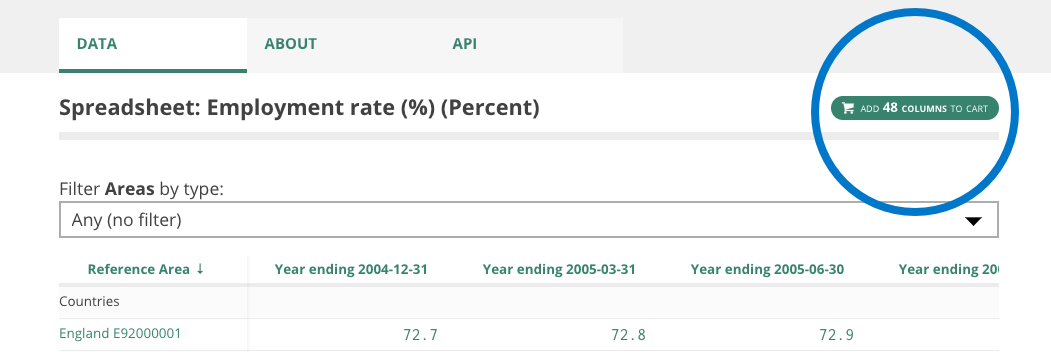
Data cart
As you search and browse through the datasets and geographic areas you can add them to the cart. When you have finished building your cart you can download the dataset for analysis in your favourite analytical tool or share the link to the csv. Read more about how to use the cart.
A final Note
We’ll write some more blog posts on getting the most out of these features over the next few weeks. In the meantime please feel free to feedback to us by email ODC@communities.gsi.gov.uk